Dashboard And Catalog Basics
Prerequisites
- You are signed in.
- Tenant and customer context are already checked in Settings.
Click Path
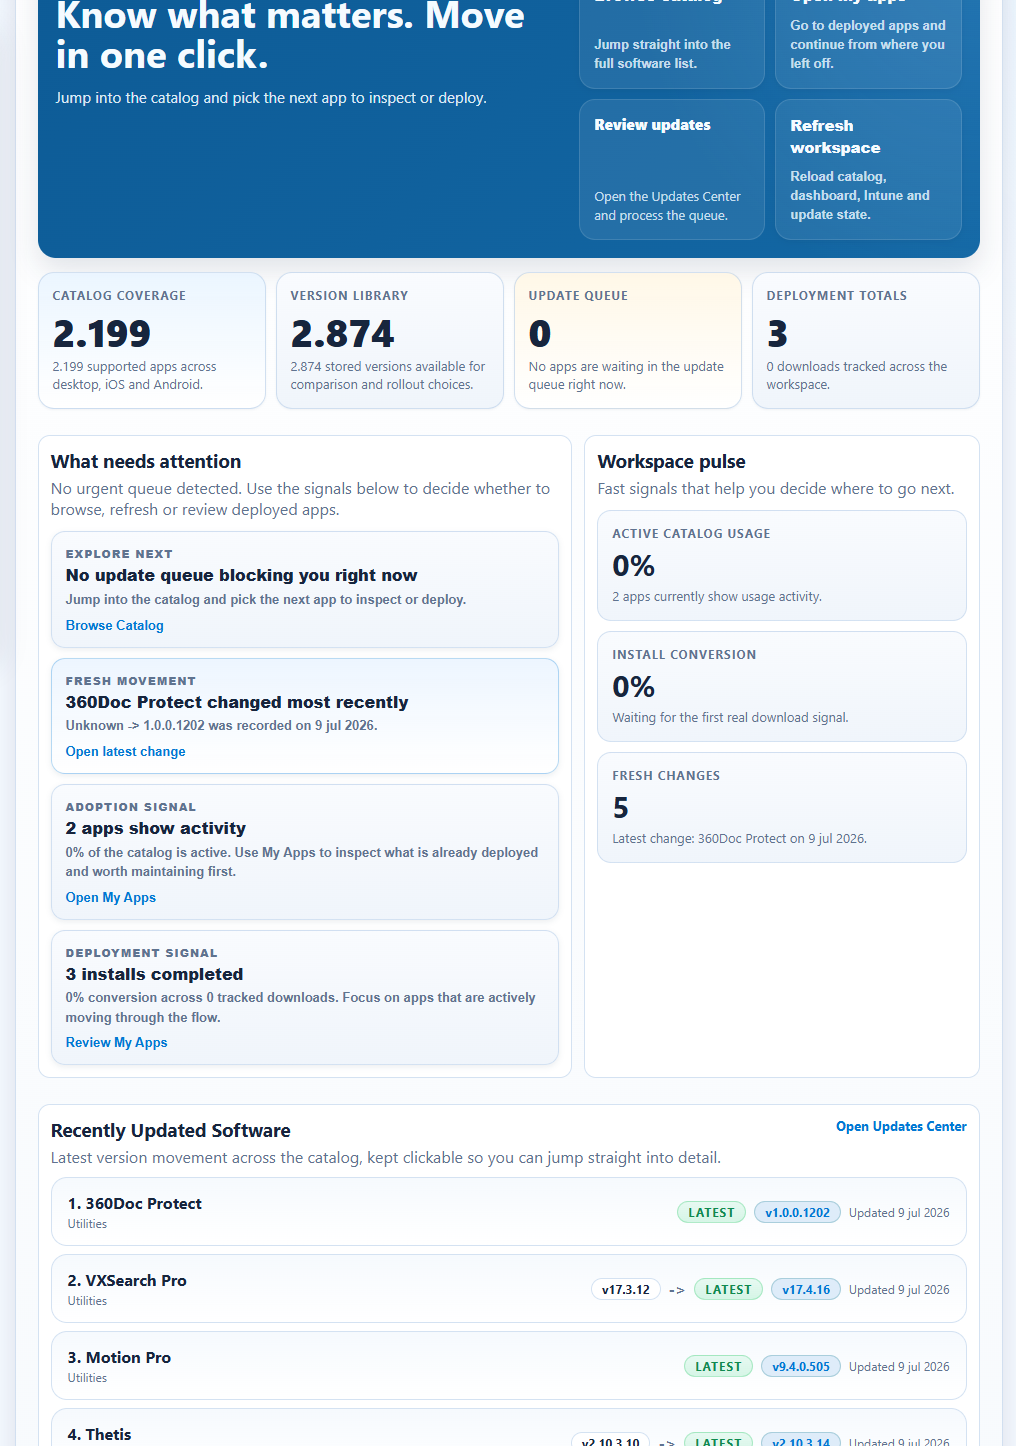
- Open
App. -
Start on
Dashboardand review action cards. -
Use the
My Appsdashboard action card when you want to jump directly to already deployed apps. -
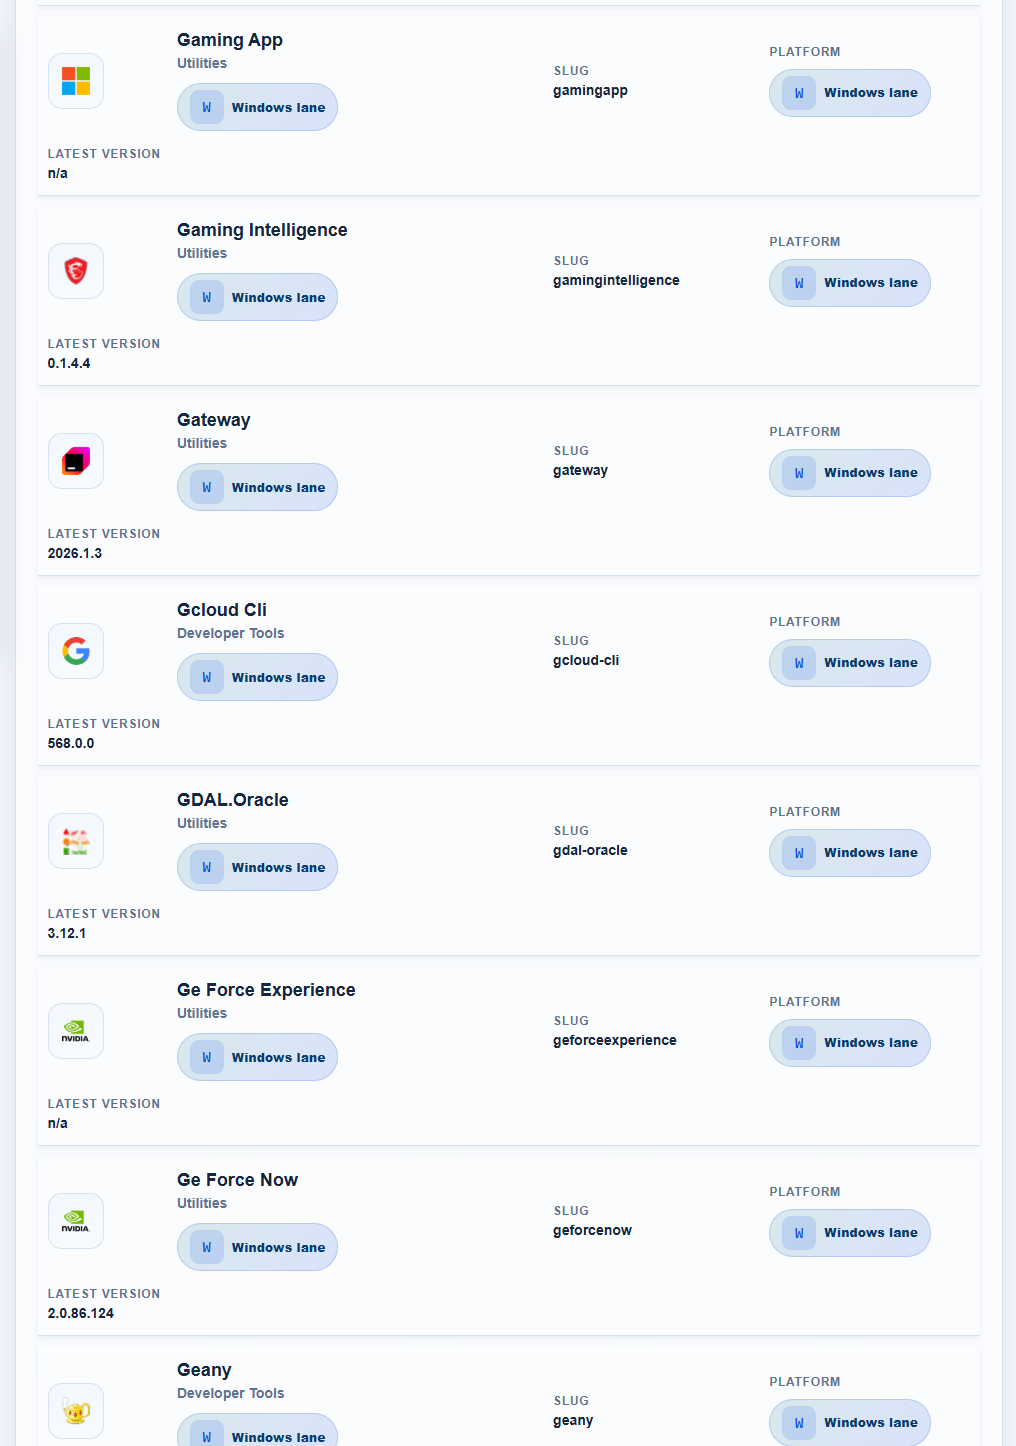
Click
Catalogtab when you want to browse the full catalog. -
Use search field or browse category sections.
- Open app detail panel only after confirming customer/tenant context.
Expected Result
- You identify what needs attention now.
- You can select the right app for next action.
- You can jump from Dashboard into
My Appsand see deployed apps grouped in the correct platform context. - You can distinguish deployed app entries correctly when the same app name exists across Windows, macOS, iOS, or Android surfaces.
- You know where to use Intune Insights export profiles for role-based reporting (
Current view,Ops,Security,Compliance). - You can read compliance reason, last check-in health, and storage severity directly in Intune Insights before exporting or opening the Intune admin portal.
- You can isolate high-risk slices quickly with dedicated Intune Insights filters for stale check-ins and missing encryption context.
- You can isolate urgent storage incidents with
Critical storage only (<10 GB)when you need strict device triage. - You can see a real-time queue status summary showing total device count and per-lane breakdown (e.g., "Total: 523 devices | 156 Stale check-in | 89 Missing encryption | 78 Critical storage | 200 Needs review").
- You can target unresolved non-compliant devices with the
Needs reviewAction Queue lane andNeeds review onlyfilter mode. - You can use the Action Queue to jump into the top triage queues in one click and read the
Why nowreason directly in the managed-device table. - You can click the
Why nowreason pill itself to immediately apply the matching filter lane. - You can use
Reset triageto clear the current queue/filter context before starting a new review pass. - You can use
Tenant health score(0-100) as an executive KPI that combines compliance, storage risk, and sync health into one immediate risk signal, and review its inline explainability breakdown to see what drives score drops. - You can check
Snapshot ageto confirm whether the current Intune dataset is fresh; if the age passes 4 hours, refresh insights before making remediation decisions. - You can open any device directly in the Intune admin portal using the
Open in Intunebutton in the device detail lightbox, or theOpen in Intune ↗link that appears on hover in each device table row. - Intune Insights visuals are polished for clarity: KPI cards show better hierarchy, queue cards have stronger contrast, table header/row styling improves scannability, and staleness warnings are more visible.
- Mobile users benefit from responsive card-based table layout (<480px) that avoids horizontal scrolling and keeps critical actions accessible.
If It Fails
- If data looks inconsistent, refresh the app workspace.
- If actions are blocked, re-check
Settings > SubscriptionandSettings > Tenant Connection. - If tenant context seems wrong, stop and switch via
Customer Workspaceor topbarCustomer. - If
My Appslooks wrong for the selected customer, re-check active customer/tenant before updating or removing anything.